Browse
Introduction
Note
All data declarations for Veda models are done in Excel files. To visualize the model, use the interface instead of relying on Excel files. Excel should be used for initial and additional data specification. To check declarations or topology for a particular item, use Browse (or Items detail).
Browsing model input is necessary for two reasons:
You may have a syntax error and some of your declarations may have been ignored, or read differently from what you intended.
The declarations for a single item may be spread across several Excel files, and you will see them all in one place in this interface.
Browse presents the actual model data.
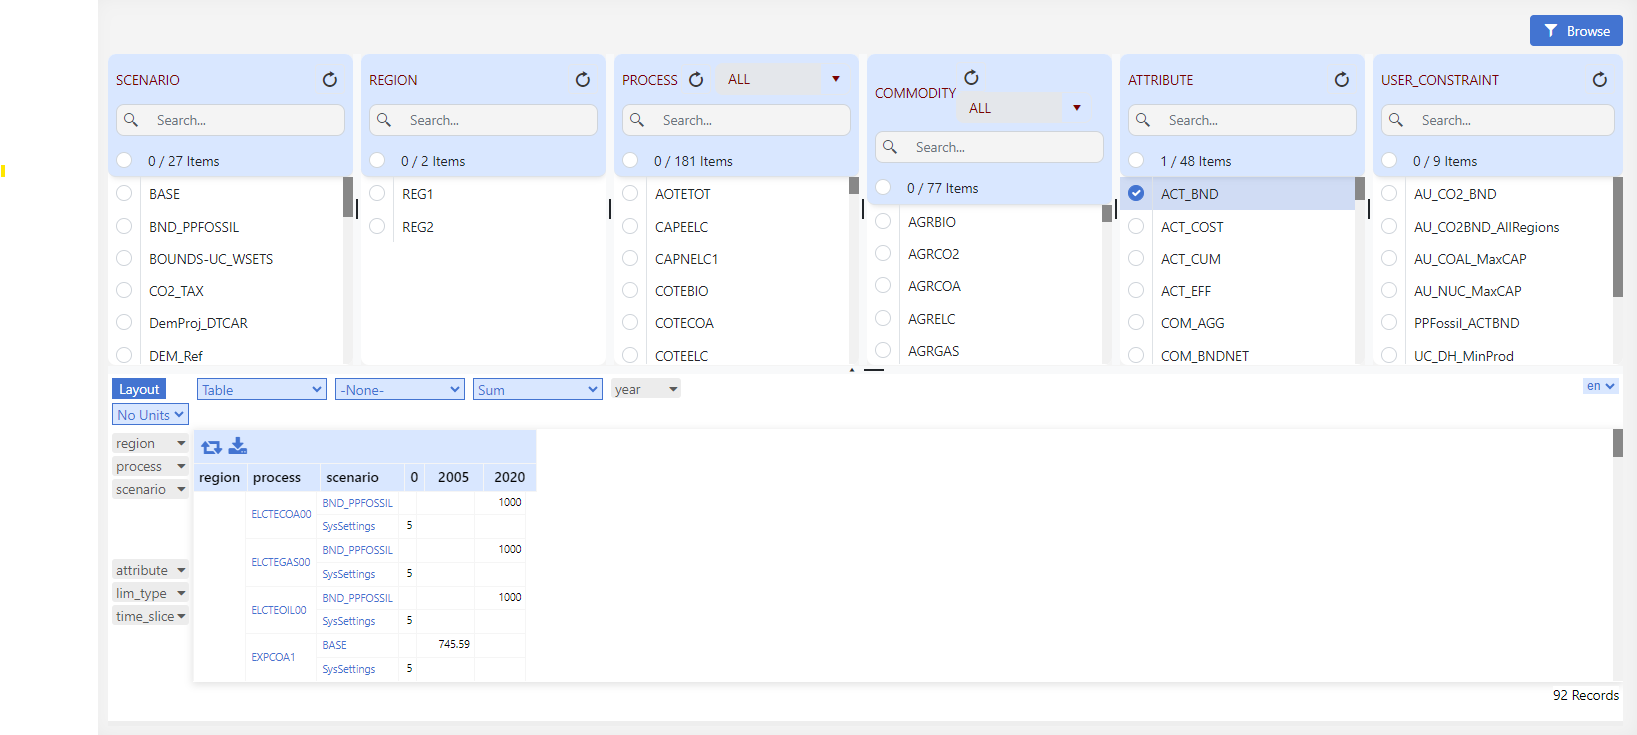
The Browser thereby enables the user to view subsets of the assembled data in a cube by selecting the scenario(s), region(s), process(es), commodity(ies), and/or the attribute(s) of interest. It is possible to rearrange the layout of the cube by adding/removing dimensions (columns and rows) to/from the table.
How to use it?
Load data in Pivot Grid
Select at least one element from any element list.
Click Browse to load data in the Pivot Grid.
Filter using sets
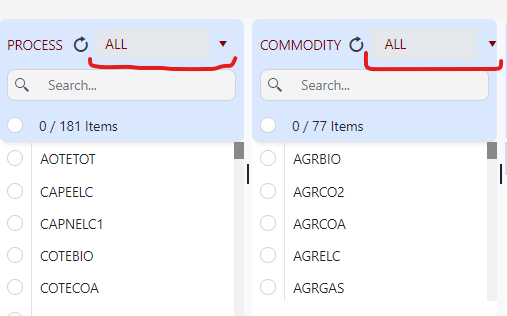
In the Process and Commodity element lists, select User Set or TIMES Set from the dropdown (as shown below).
The selected set filters the linked elements.