Items detail
Introduction
This shows the basic information, topology, and parameters for all items - processes, commodities, user constraints, and commodity groups.
Basic description of a TIMES process
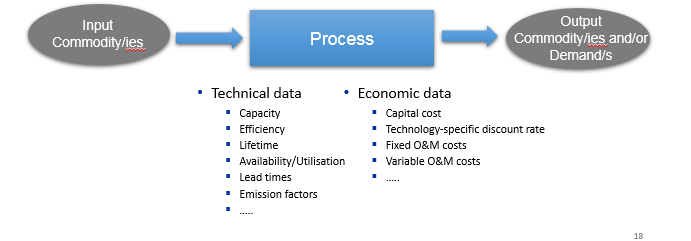
A process converts input commodity(ies) to output commodity(ies)
Each process is linear (e.g. output proportional to input, investment and fixed O&M costs scale with capacity / variable O&M scale with activity)
A power plant converts input fuel (e.g., coal/oil/gas/nuclear/renewable source) in electricity
A plug-in diesel hybrid car can be modelled as a process that converts electricity and/or diesel to passenger-miles
A typical national model may have ~1000 processes
How to use it?
Select the region from the drop-down list to filter Process, Commodity, UserConstraint, and Commodity Group.
Select an element from the list to see the data.
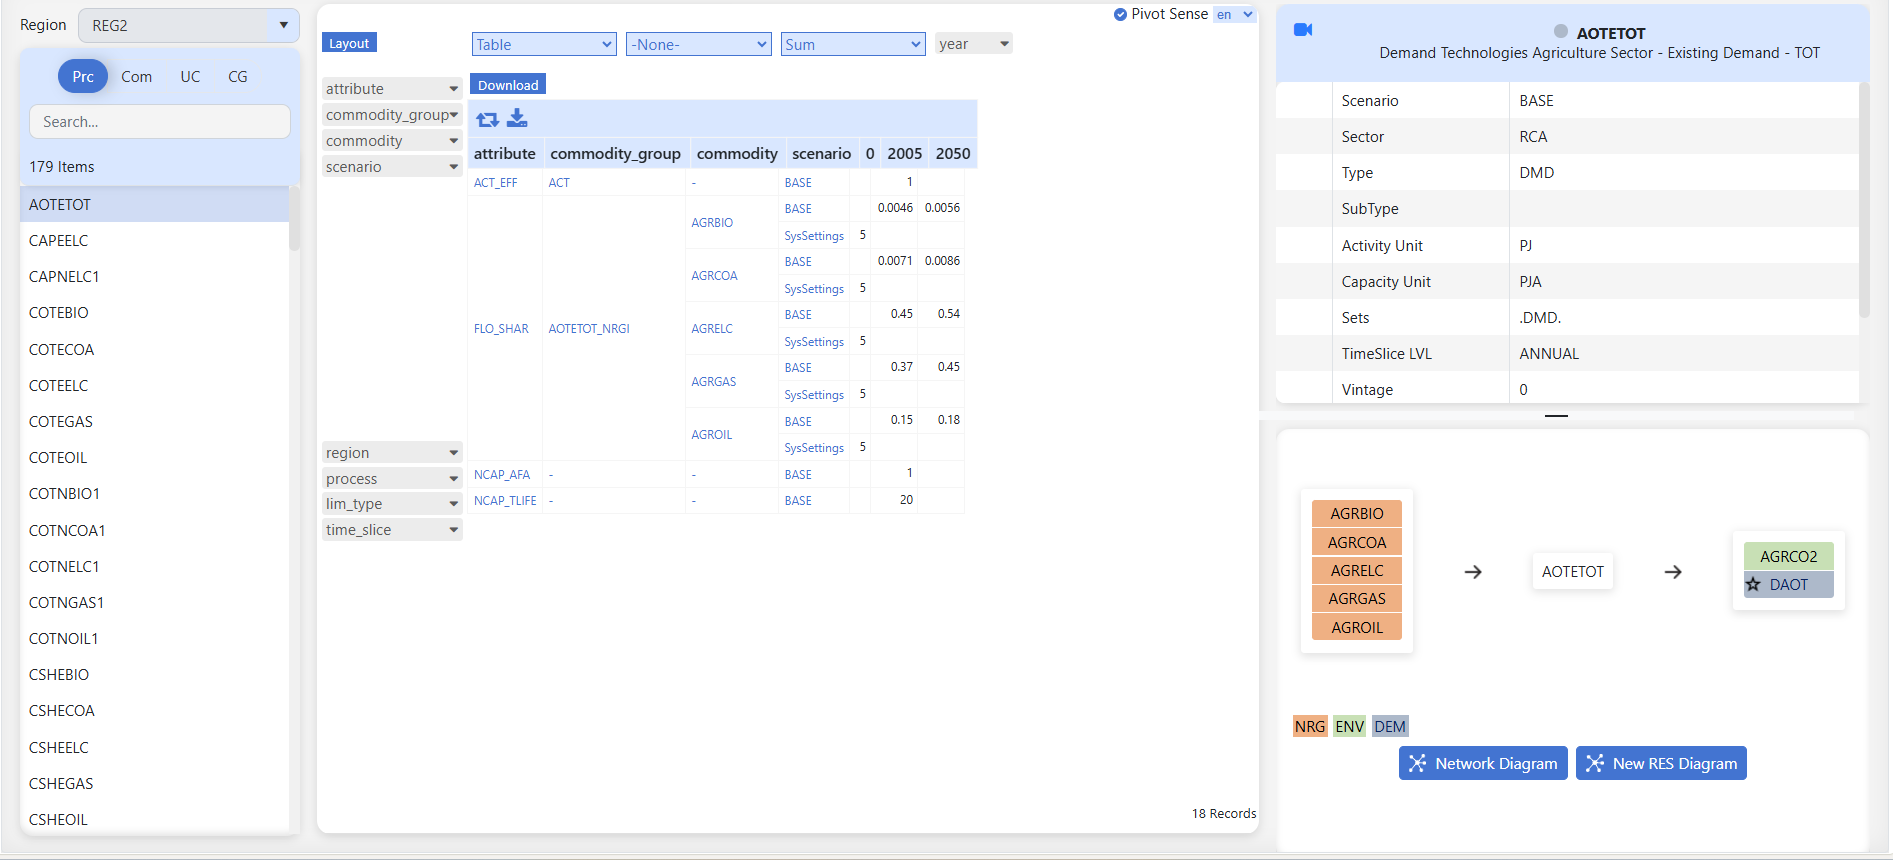
Where to view the data
- Pivot View
Note
Coming soon. Detailed documentation for Pivot view will be added here. The image above is a visual reference.- Detailed View
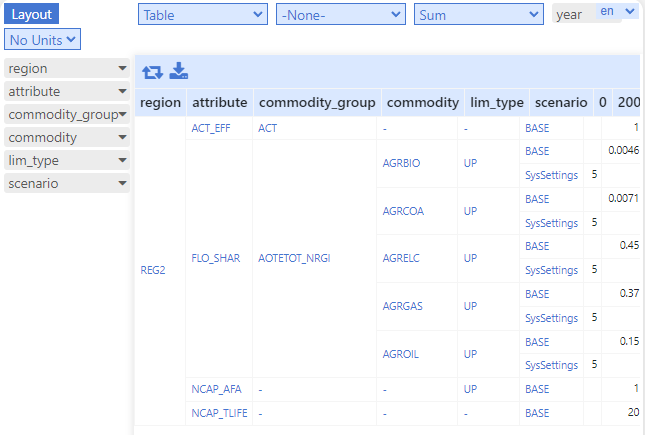
Note
Coming soon. Detailed documentation for Detailed view will be added here. The image above is a visual reference.- Basic View
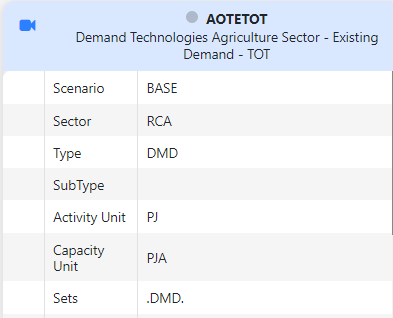
Note
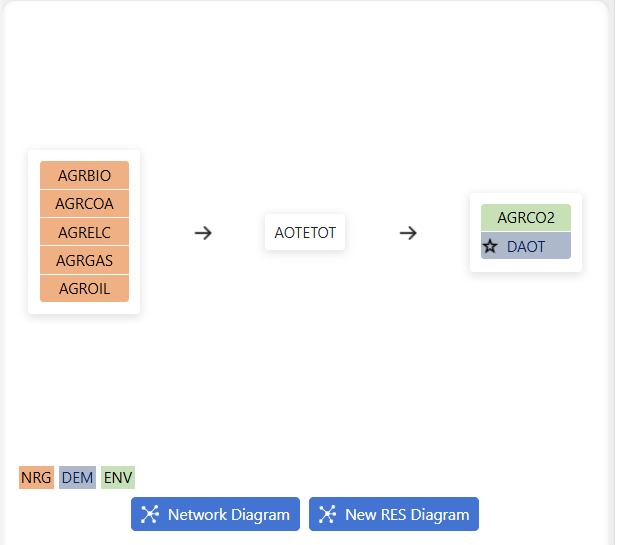
Coming soon. Detailed documentation for Basic view will be added here. The image above is a visual reference.- Network Diagram
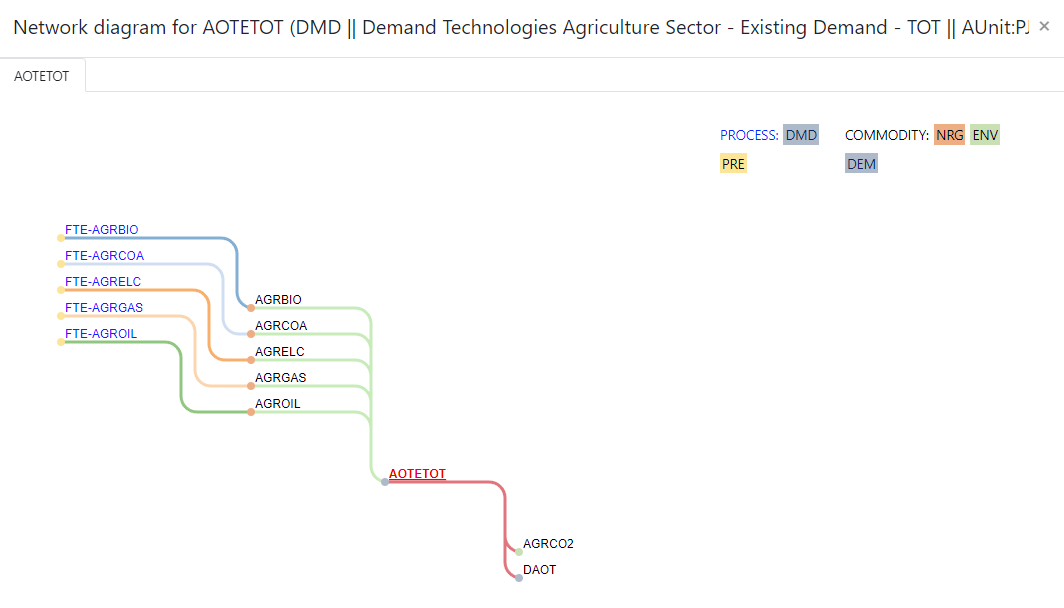
Note
Coming soon. Detailed documentation for Network Diagram will be added here. The image above is a visual reference.- New RES Diagram
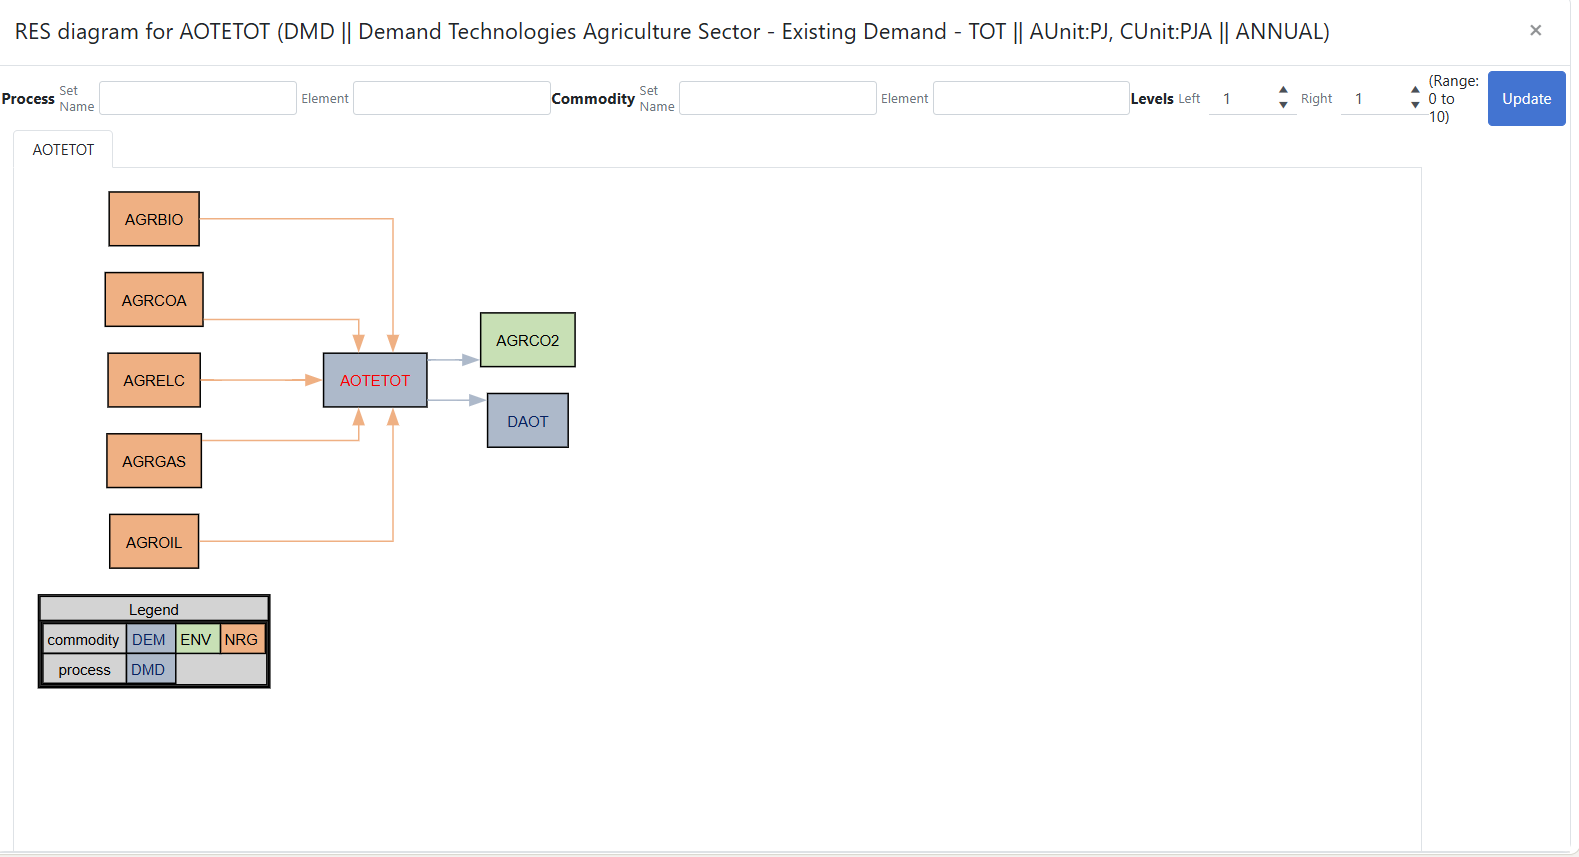
Note
Coming soon. Detailed documentation for New RES Diagram will be added here. The image above is a visual reference.